
I’m a big fan of user review sites. I’ve been using TripAdvisor since at least 2002 to help plan my journeys, and Yelp is my new favourite site since moving to the US.
Crowdsourcing information is usually a pretty good way of doing things. There’s been plenty of research which has shown that if you get a crowd of people together and have them, for instance, guess the total number of jelly beans in a jar, the average guess will be pretty close to the real number. Translating this to something usable in everyday life, I’ve seen people have a lot of success with Amazon’s Mechanical Turk for aiding research, since you can use the sheer weight of numbers to smooth the data.
This is great for something tangible and objective. However, as soon as you start throwing subjective data into the mix, results get a little skewed.
In particular I’ve noticed lately I can’t quite trust online reviews (from a wide variety of users) the way I used to. I’m not sure why things have gotten so skewed — perhaps I’m more discerning now, or maybe there are more outliers. Either way, I haven’t trusted the average rating on sites like Amazon, Yelp and TripAdvisor for a couple of years now. Instead I read a sample of reviews and then go straight to the upper and lower bounds and try to get a sense of why people are voting in a particular fashion. Is the product/place being reviewed being unfairly penalized or rewarded? (for example, a hotel might get a lot of 1 star reviews for high parking fees, but are great otherwise. A restaurant might get a lot of 5 star reviews because they’re cheap and have a nice ambiance, even though the food stinks.)
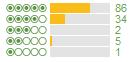
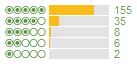
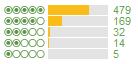
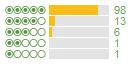
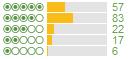
One method I’ve found for making a better decision is to look at the shape of the score curve. For example, here are the scores for the top 5 TripAdvisor hotels in San Francisco at the moment, order by TripAdvisor by their average score:
 1
1
 2
2
 3
3
 4
4
 5
5
There aren’t any that really stick out there as being obviously different, but you can see that the fourth one gets a far higher ratio of 5 star ratings to 4 star ratings than the others. These differences become more pronounced the further down the overall list of hotels you go. Hotel A is rated as a better hotel than Hotel B which is ranked (according to its average) after it:
Hotel A:
Hotel B:
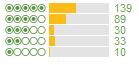
Whenever I see a curve difference like this though, I always go for the latter when booking. Since I changed tactics, I have been having great hotel experiences. To give this a quantifiable score to compare, I tried out the following formula:
If ((x star votes) – (x-1 star votes)) > 0 then
y = x
else
y = 5 – (x – 1)
(y*(5votes – 4votes) + y*(4votes – 3votes) + y*(3votes – 2votes) + y*(2votes – 1votes) + 1votes) / total votes
Using a formula such as this the new overall scores become:
(260 + 96 – 9 + 8 + 1) / 128 = 2.78125
(600 + 108 + 6 + 8 + 2) / 206 = 3.51456
(1550 + 548 + 54 + 18 + 5) / 699 = 3.11159
(425 + 28 + 15 + 0 + 1) / 119 = 3.94117
(1260 + 948 + 60 + 16 + 13) / 883 = 2.60136
Which as you can see results in a much better looking ranking for the curves:
4
2
3
1
5
If we apply the formula to the hotels A and B, we see the difference becomes more pronounced:
(-26 + 244 + 15 + 22 + 6) / 185 = 1.41081
(250 + 236 – 9 + 46 + 10) / 301 = 1.77076
Introducing a new overall score would help people pick better hotels and for the hotel owners to strive for higher ratings. I’m also a big fan of the trending data that Yelp has added recently, using Patxi’s as an example:
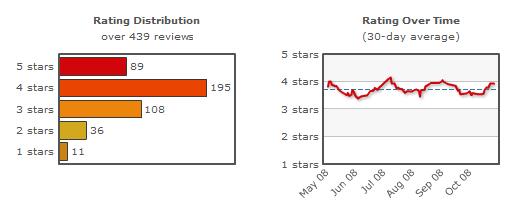
Coming from someone who wrote his thesis on qualitative user feedback, this has been really interesting for me to look at how you can properly interpret large amounts of quantitative data involving subjective scores.
Update November 7 2008: Thanks to Eric Liu for pointing out some weighting issues depending on vote numbers. We’re brainstorming some new algorithms to account for these situations.
In the meantime, anyone from the myriad of Netflix people who have stopped by, feel free to contact me! tim@<this domain>.
